Observed: April 8, 2026 · Route: New York (all airports) → London (all airports) · Dates: May 3–11, 2026 · Source: Google Flights
What We Observed Yesterday on Google Flights
On April 8, 2026, Google Flights showed $728 as the best available roundtrip non-stop economy fare between New York and London for May 3–11. American Airlines and British Airways led the direct options at $728–$778. One-stop itineraries — SAS being the most visible — dropped to around $450. The platform badge: “Prices are currently typical for this route.”
A lot of travelers looked at that number and saw something close to a deal. It’s below $800. It’s on a major transatlantic corridor. It’s non-stop. On the surface, it looks competitive.
It isn’t a deal. And understanding why is more useful than the price itself.
NYC → London, May 3–11, 2026. Source: Google Flights, April 8, 2026.
The full spread on April 8
- Non-stop “Best” fares: $728–$778 RT economy (American Airlines, British Airways, Iberia/Finnair operated by BA)
- One-stop options: from ~$450 RT (SAS, KLM, Aer Lingus)
- Other visible carriers: JetBlue, Delta, United
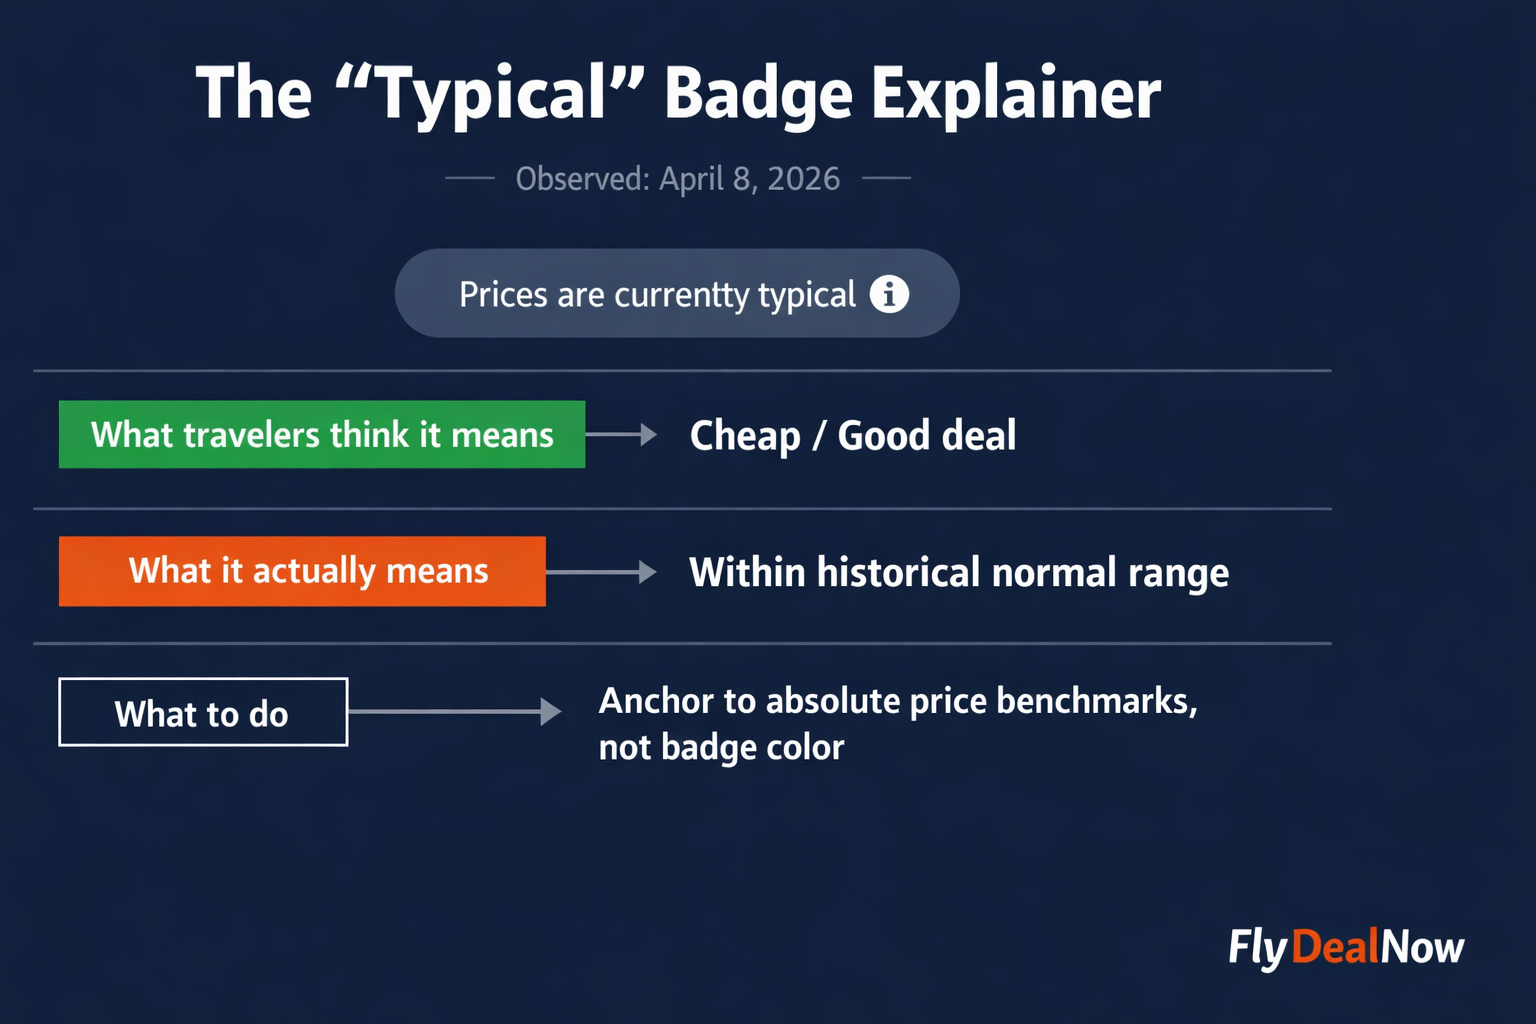
- Google Flights badge: “Prices are currently typical”
What “Prices are currently typical” means in practice
“Typical” on Google Flights does not mean cheap. It means the current fare sits within the historical range Google considers normal for this route and travel window. On NYC–London for early May, that range is approximately $750–$900 RT non-stop. At $728, the fare is actually at the low end of that band — the market floor, not a compression window. Google is confirming equilibrium, not signaling opportunity.
What “Typical” Means — And What It Doesn’t
The distinction matters because of how most travelers use flight search tools. They scan for green. They see “lower than usual” and interpret it as a buying signal. But the color scale on Google Flights is relative — it tells you where today’s price sits within the recent range for that specific search, not whether the price is objectively good.
A fare can be “lower than usual” and still be $850. A fare can be “typical” and still be the lowest you’ll see before your travel date. Neither the badge nor the color tells you what to do. Only an absolute benchmark does.
Why “typical” is not a synonym for “cheap”
Google calculates the “Typical price” badge by comparing the current fare against historical pricing data for the same route and travel window. If fares have been consistently running $800–$950 for early May NYC–London, a fare at $728 may well show as “typical” or even “lower than usual” — while still being $128 above what FlyDealNow considers a genuine deal threshold on this route.
The color scale trap
Google’s date grid goes green when a price is lower than nearby dates — not when it’s objectively good. A $750 fare can show green if everything around it is $900. That doesn’t make $750 a deal on NYC–London. It makes it less expensive than $900. These are not the same statement.
The rule: always anchor to absolute price benchmarks, not relative color coding.
The NYC–London Price Benchmark in 2026
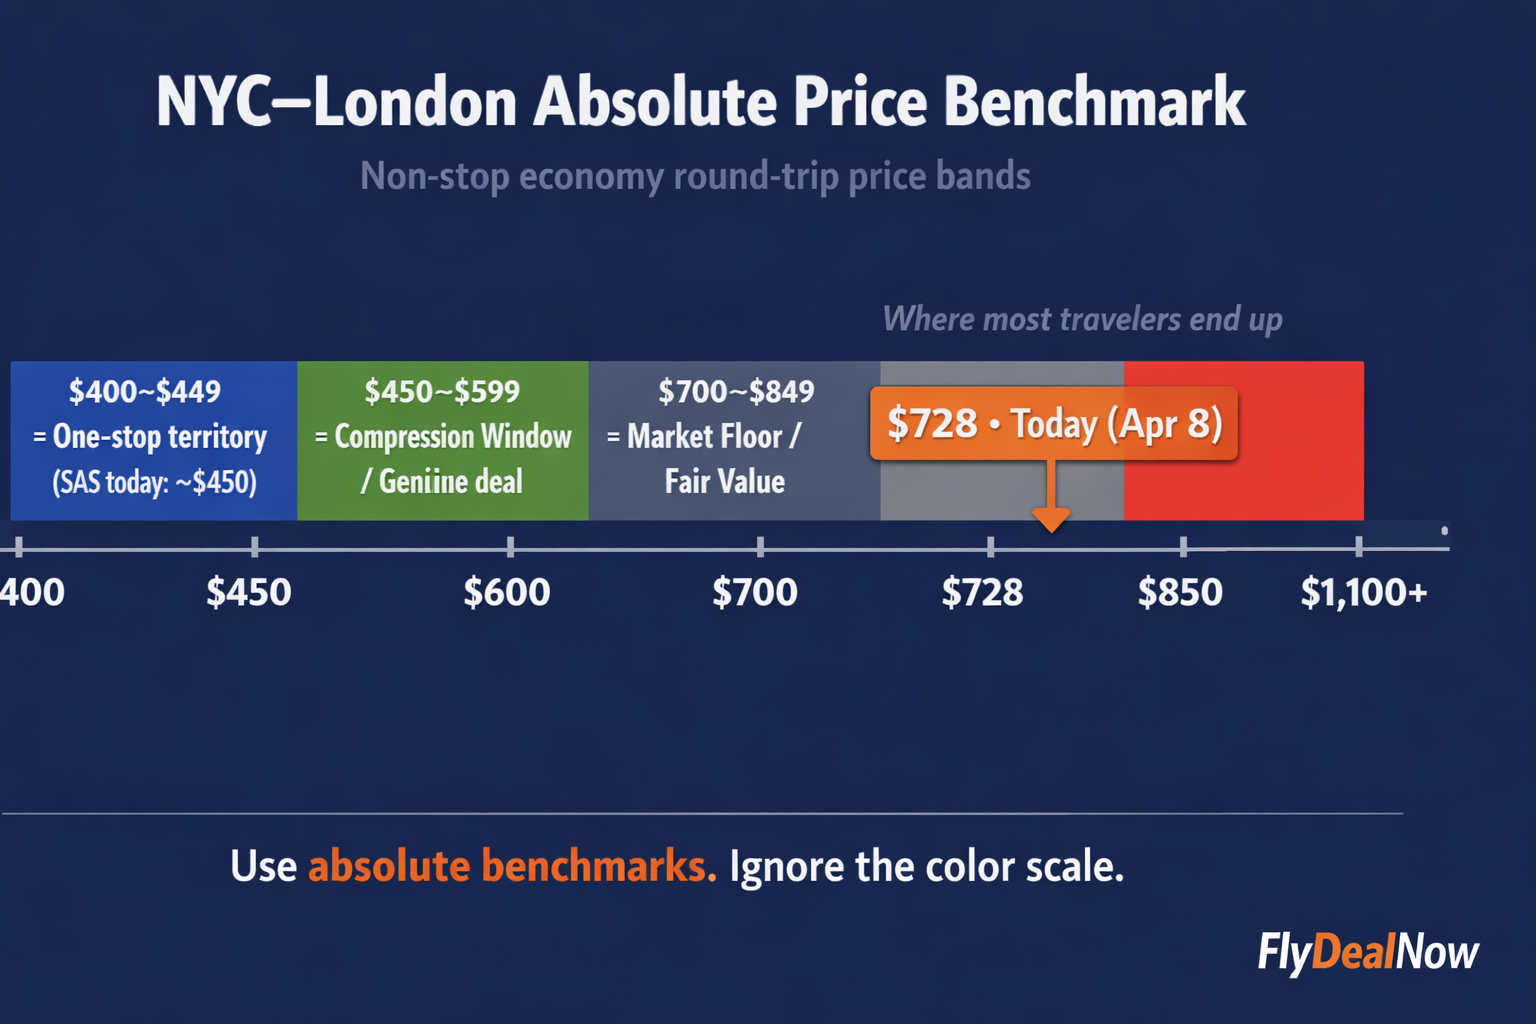
FlyDealNow tracks this corridor continuously. Here is how we define the price zones for NYC–London non-stop economy in the current booking environment:
| Price range (RT non-stop) | What it signals | What to do |
|---|---|---|
| Under $600 | Compression window — fares below market floor | Act within 24–48 hours if dates work |
| $700–$850 | Market floor / fair value for shoulder season | Defensible to book if dates are fixed |
| $900+ | Late-booking default pricing | You waited too long, or it’s peak demand |
FlyDealNow price benchmark — NYC–London non-stop, early May 2026.
At $728 on April 8, NYC–London sits at the low end of the fair-value band. Not in compression window territory. Not overpriced. The market floor.
The compression window threshold: under $600 RT non-stop
A compression window — the brief period when fares drop measurably below the market floor — requires a specific combination of reduced demand, available low-inventory buckets, and competitive pressure between carriers. The last time this route entered compression window territory was late March 2026, when non-stop roundtrips briefly dropped to $547 for this same May 3–11 window. That window lasted days, not weeks, and prices reset to the current $728–$778 range shortly after.
Yesterday’s $728 fare is $128 above the compression window threshold. It is a useful reference point. It is not a buying trigger.
How to Read the Google Flights Date Grid Without Getting Fooled
The Date Grid is one of Google Flights’ most useful tools when used correctly — and one of the most misleading when used intuitively.
What the color scale is actually measuring
Each cell in the Date Grid is colored relative to the other cells in the same grid view. The lowest-priced dates get the darkest green. The highest-priced dates get red or orange. This is purely comparative within the grid — it has no relationship to whether any given price is objectively good or bad.
If every date in May costs between $850 and $1,100, the $850 dates will still show as green. If every date costs between $600 and $700, the $700 dates will show as red. The color is a ranking, not a verdict.
How to anchor to an absolute number, not a relative color
The correct way to use the Date Grid: look at the actual dollar figures in each cell, compare them against your absolute benchmark for the route, and identify any dates where the price falls below that benchmark. Ignore the color. Use the number.
For NYC–London non-stop: your benchmark is $600 for a compression window, $700–$850 for fair value. Any date showing below $600 warrants immediate attention. Any date in the $700–$850 range is standard. Color coding adds no information you don’t already have from the numbers.
Using the ±3-day range to find real softness
Even within a “Typical” pricing environment, the Date Grid often shows $30–$80 variance across adjacent dates. If your travel window has any flexibility — even one or two days — scanning the ±3-day range around your ideal dates can surface meaningful savings without waiting for a full compression window. For the May 3–11 window specifically, check departures on May 1–2 and May 4–5, and returns on May 9–10 and May 12–13. [Verify current fares on Google Flights before deciding.]
The One-Stop at $450 — Is It Worth the Math?
SAS and comparable carriers are currently showing one-stop itineraries to London from New York at around $450 RT — roughly $278 less than the best available non-stop. That gap is real. Whether it’s worth it depends entirely on your constraints.
Real cost of saving $278
- Additional transit time: typically 2–5 hours depending on connection, bringing total journey time from ~7 hours to 10–13 hours
- Connection risk: a missed connection on a transatlantic itinerary can mean a 24-hour delay. The probability is low but the cost is high.
- Baggage fees: some one-stop carriers at this price point charge for checked bags. Verify before booking — a $60 bag fee closes the gap to $218 saved.
- Layover airport: not all connecting airports are equal. A 2-hour connection in Copenhagen is different from a 2-hour connection in a smaller hub.
When the one-stop makes sense
If you have schedule flexibility on both ends of the trip, a low-stress relationship with airport time, and you’re traveling carry-on only, the $450 one-stop can be a rational choice. If your May 3 departure is time-sensitive, if you’re traveling with checked baggage, or if a missed connection would create significant problems, the $278 saving is likely not worth the exposure.
Looking for more route analysis? See our breakdown of New York to Mexico City: The Cheapest Week Isn’t the One You Think and Chicago to Tokyo: Everyone Books Summer. The Data Says September.
Should You Book at $728?
This is not a deal. It is the current market floor. That changes the calculus.
Fixed dates, carry-on only, no flexibility: $728 is at the bottom of the fair-value band. If the Date Grid shows no softer fares within ±3 days, and you have no flexibility to wait, this is a defensible booking. You are not getting a deal — you are paying a fair price. That is acceptable.
Fixed dates, need checked baggage: Add $60–$100 RT in bag fees. Effective fare: $788–$828. Still within the fair-value band, but verify total cost before confirming.
Flexible on dates: Run the Date Grid before deciding. Check ±3–5 days around May 3–11. A $30–$60 variance is possible. [Verify on Google Flights.]
Considering the $450 one-stop: Run the full math — time, connection risk, bag fees — before treating it as a $278 saving. It may be. It may not be.
Waiting for a compression window under $600: Possible before May 3, not probable at this stage of the booking horizon. If you have the flexibility to monitor and act within 24–48 hours of a price drop, monitoring costs you nothing. If not, $728 is your realistic floor.
The Total Cost Picture — Flight + London
The flight is only part of the decision. At $728 RT, a 7-night stay in London at $90–$120/night keeps your total trip cost in the $1,358–$1,568 range — assuming you control accommodation spend. The flight is at the market floor. Where you sleep is the remaining variable that determines whether the overall trip is efficient.
Current budget hotel options for the May 3–11 window in London: search current availability on Booking.com.
All prices observed on Google Flights, April 8, 2026. Fares change continuously — verify before booking. FlyDealNow tracks this route regularly; subscribe to the newsletter for compression window alerts.
FlyDealNow Team
We help travelers pay less for flights using real pricing data — not hacks or guesswork.
✈️ Get My Personalized Flight Deal — $39or explore the Flight Pricing Blueprint — $29